Rayx uses a number of languages but mainly C++ and GLSL.
Debugging the application's C++
If you are using VS Code, you may create a new Debugging Setting to launch rayx through gdb. More here
Once the setting file (launch.json) is ready, you can change and add arguments for VSCode/gdb to parse.
- set "program" : "${workspaceFolder}/build/bin/TerminalApp" (For TerminalApp)
- set "args" : [arg1,arg2 etc.] (keep arguments between " " )
- set "cwd" : "${workspaceFolder}/build/bin/"
If you are familiar with gdb, add more commands in setupCommands, eg. Disassembly Flavor for Intel
Debugging the application's Vulkan and GLSL
The shader language (GLSL) does not offer live debugging and stepping with gdb or similar. If you run the CPU Tracer then you can step through the code as it was compiled into C code, since it's only running on the CPU. However when using Vulkan a few more steps needs attention.
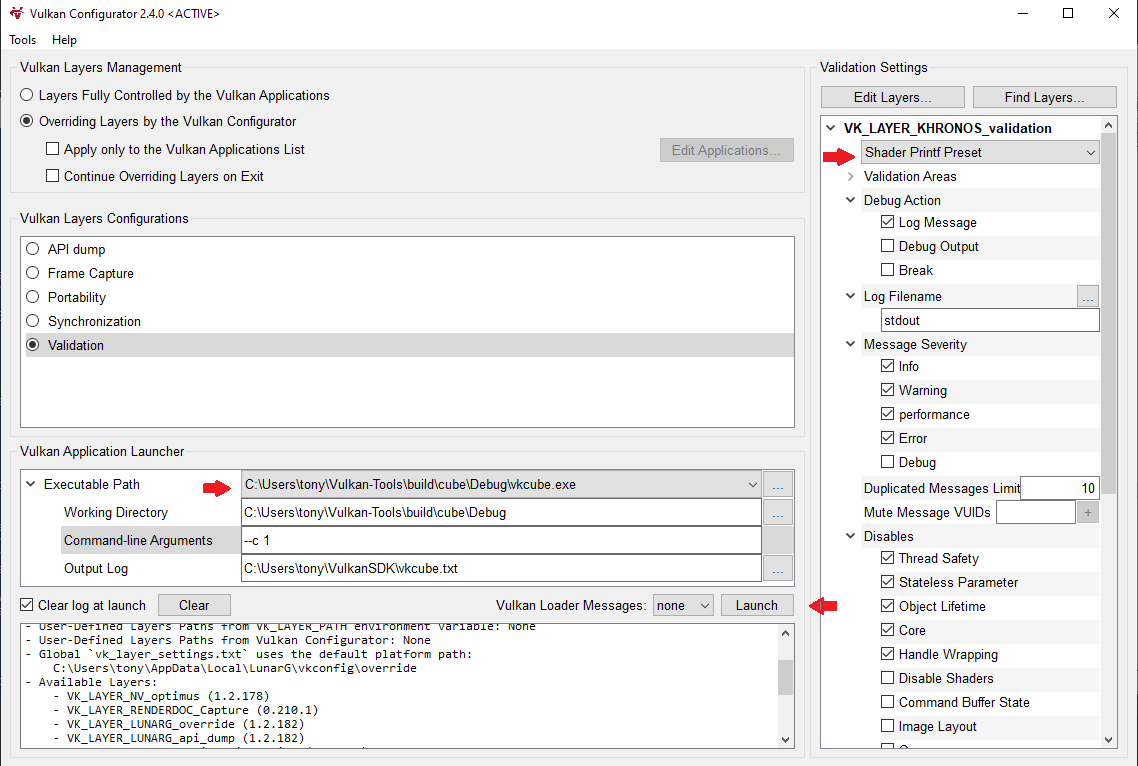
Vulkan offers a debug extension layer that can be activated with the combination of vkconfig to launch the application in debug mode.
-
We need
#extension GL_EXT_debug_printf : enablein the shader file. -
We also need to add
VK_KHR_shader_non_semantic_infoas in extension in the Vulkan Instance. -
Launch the application with vkconfig and chose the Debug Printf Preset in VK_LAYER_KHRONOS_validation. (Vkconfig should be packaged with Vulkan-SDK)
-
Make sure to increase Printf buffer size under Debug Printf if you get a Validation Layer Warning.
